Contents
TOI-178
This animation shows a representation of the orbits and movements of the planets in the TOI-178 system. New research by Adrien Leleu and his colleagues with several telescopes, including ESO’s Very Large Telescope, has revealed that the system boasts six exoplanets and that all but the one closest to the star are locked in a rare rhythm as they move in their orbits (represented in orange). In other words, they are in resonance. This means that there are patterns that repeat themselves rhythmically as the planets go around the star, with some planets aligning every few orbits.
In this artist’s animation, the rhythmic movement of the planets around the central star is represented through a musical harmony, created by attributing a note (in the pentatonic scale) to each of the planets in the resonance chain. This note plays when a planet completes either one full orbit or one half orbit; when planets align at these points in their orbits, they ring in resonance.
Music of the Spheres
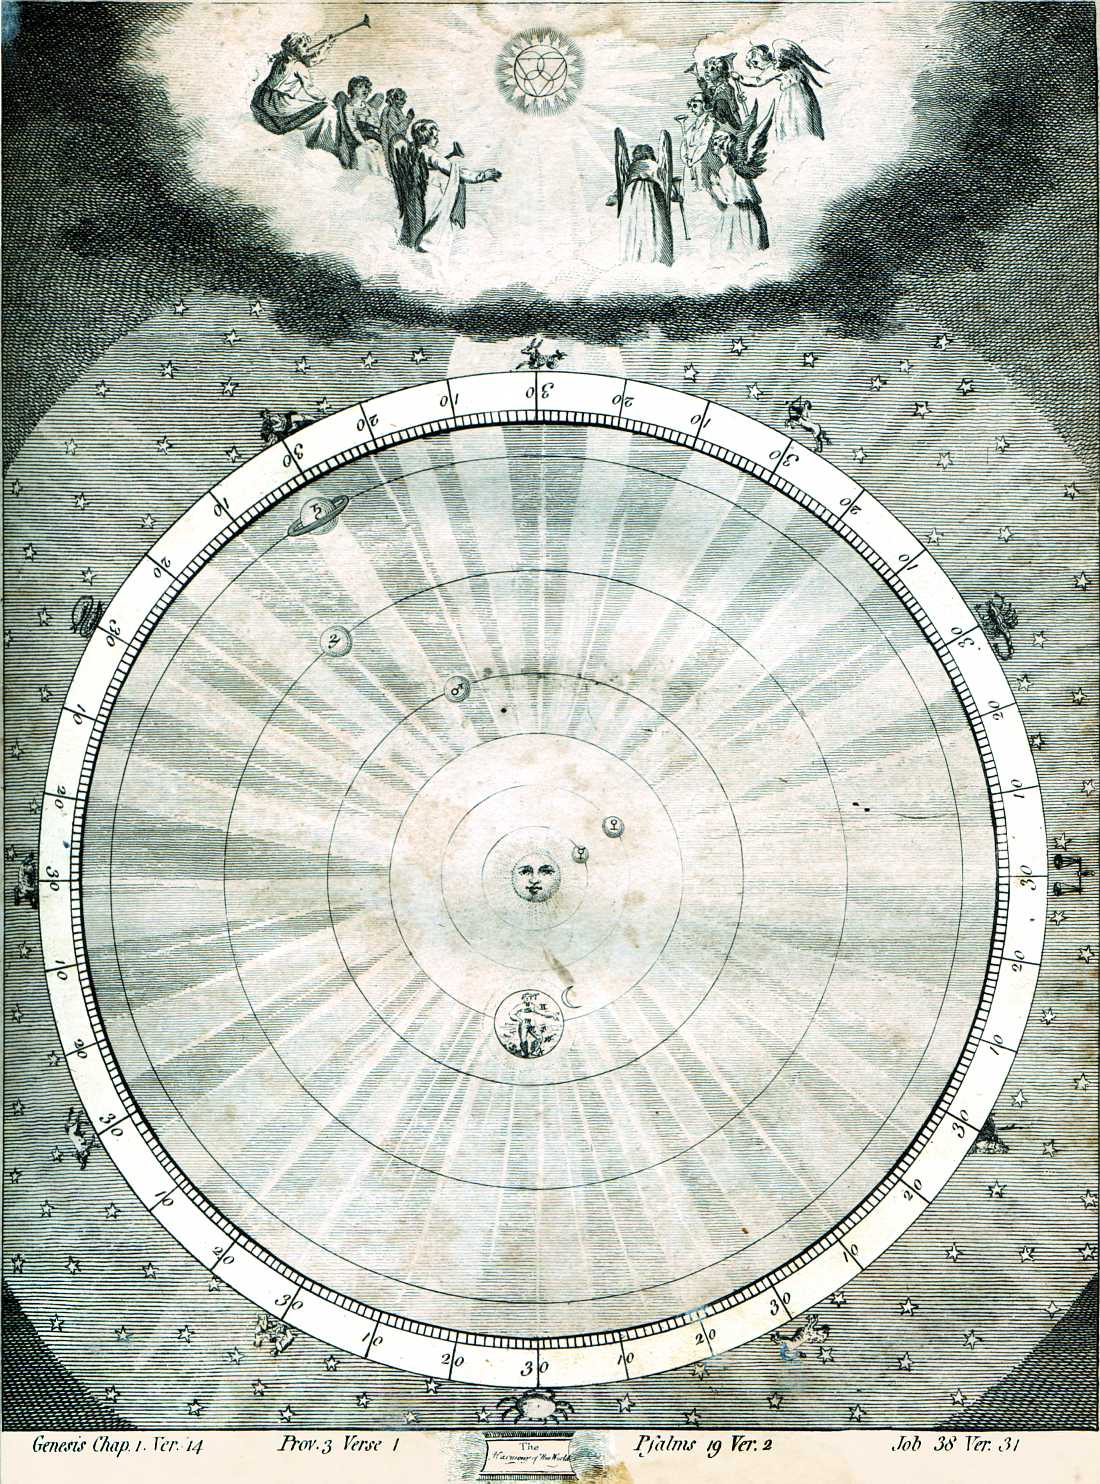
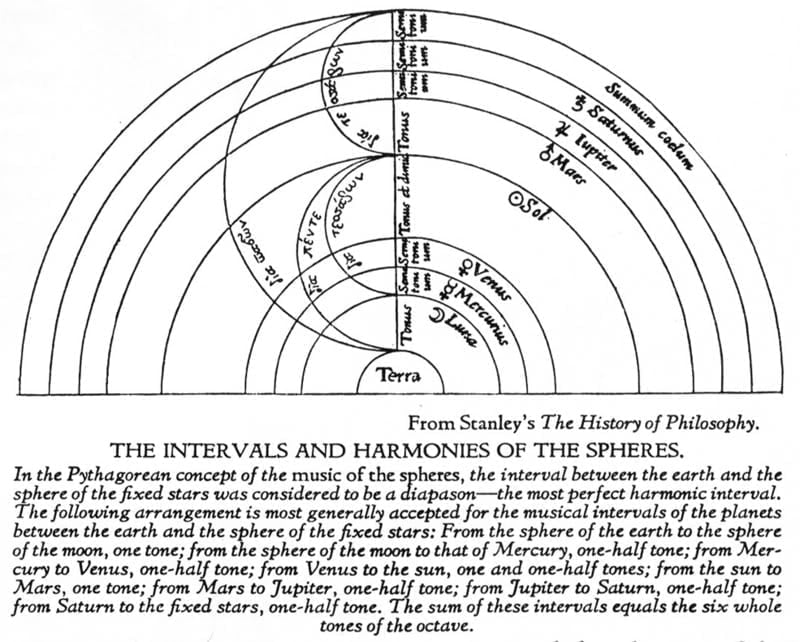
The musica universalis (literally universal music), also called music of the spheres or harmony of the spheres, is a philosophical concept that regards proportions in the movements of celestial bodies – the Sun, Moon, and planets – as a form of music. The theory, originating in ancient Greece, was a tenet of Pythagoreanism, and was later developed by 16th-century astronomer Johannes Kepler. Kepler did not believe this “music” to be audible, but felt that it could nevertheless be heard by the soul. The idea continued to appeal to scholars until the end of the Renaissance, influencing many schools of thought, including humanism.
Musica universalis — which had existed as a metaphysical concept since the time of the Greeks — was often taught in quadrivium, and this intriguing connection between music and astronomy stimulated the imagination of Johannes Kepler as he devoted much of his time after publishing the Mysterium Cosmographicum (Mystery of the Cosmos), looking over tables and trying to fit the data to what he believed to be the true nature of the cosmos as it relates to musical sound. In 1619, Kepler published Harmonices Mundi (literally Harmony of the Worlds), expanding on the concepts he introduced in Mysterium and positing that musical intervals and harmonies describe the motions of the six known planets of the time. He believed that this harmony — while inaudible — could be heard by the soul, and that it gave a “very agreeable feeling of bliss, afforded him by this music in the imitation of God.” In Harmonices, Kepler — who took issue with Pythagorean observations — laid out an argument for a Christian-centric creator who had made an explicit connection between geometry, astronomy, and music, and that the planets were arranged intelligently.
The Sun’s Wobble
The planets of our solar system also have a rhythm. Their own music.
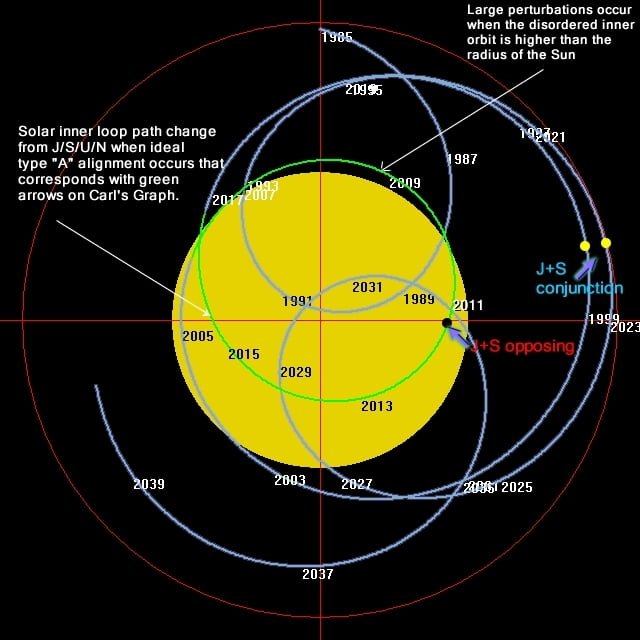
This timelapse animation illustrates the combined effect that the movement of the planets has upon the sun’s position relative to the solar system barycentre. This “wobble” is one method employed to detect exoplanets when observing distant stars.
Our star follows a multi-helical path which correlates with the various solar activity cycles. Perhaps the best known of these is the ~11 year Schwabe/El Niño Cycle which approximates Jupiter’s 11.8 year orbit. Certain of these cycles correlate to major climatic changes (such as ice-ages) in the paleo-geological rock, sediment and ice-core records.
This diagram and animations illustrate this motion over a period of decades.
Climate Quartet
The movement of the outer planets – the four gas giants – has a significant correlation to solar activity and climate cycles.
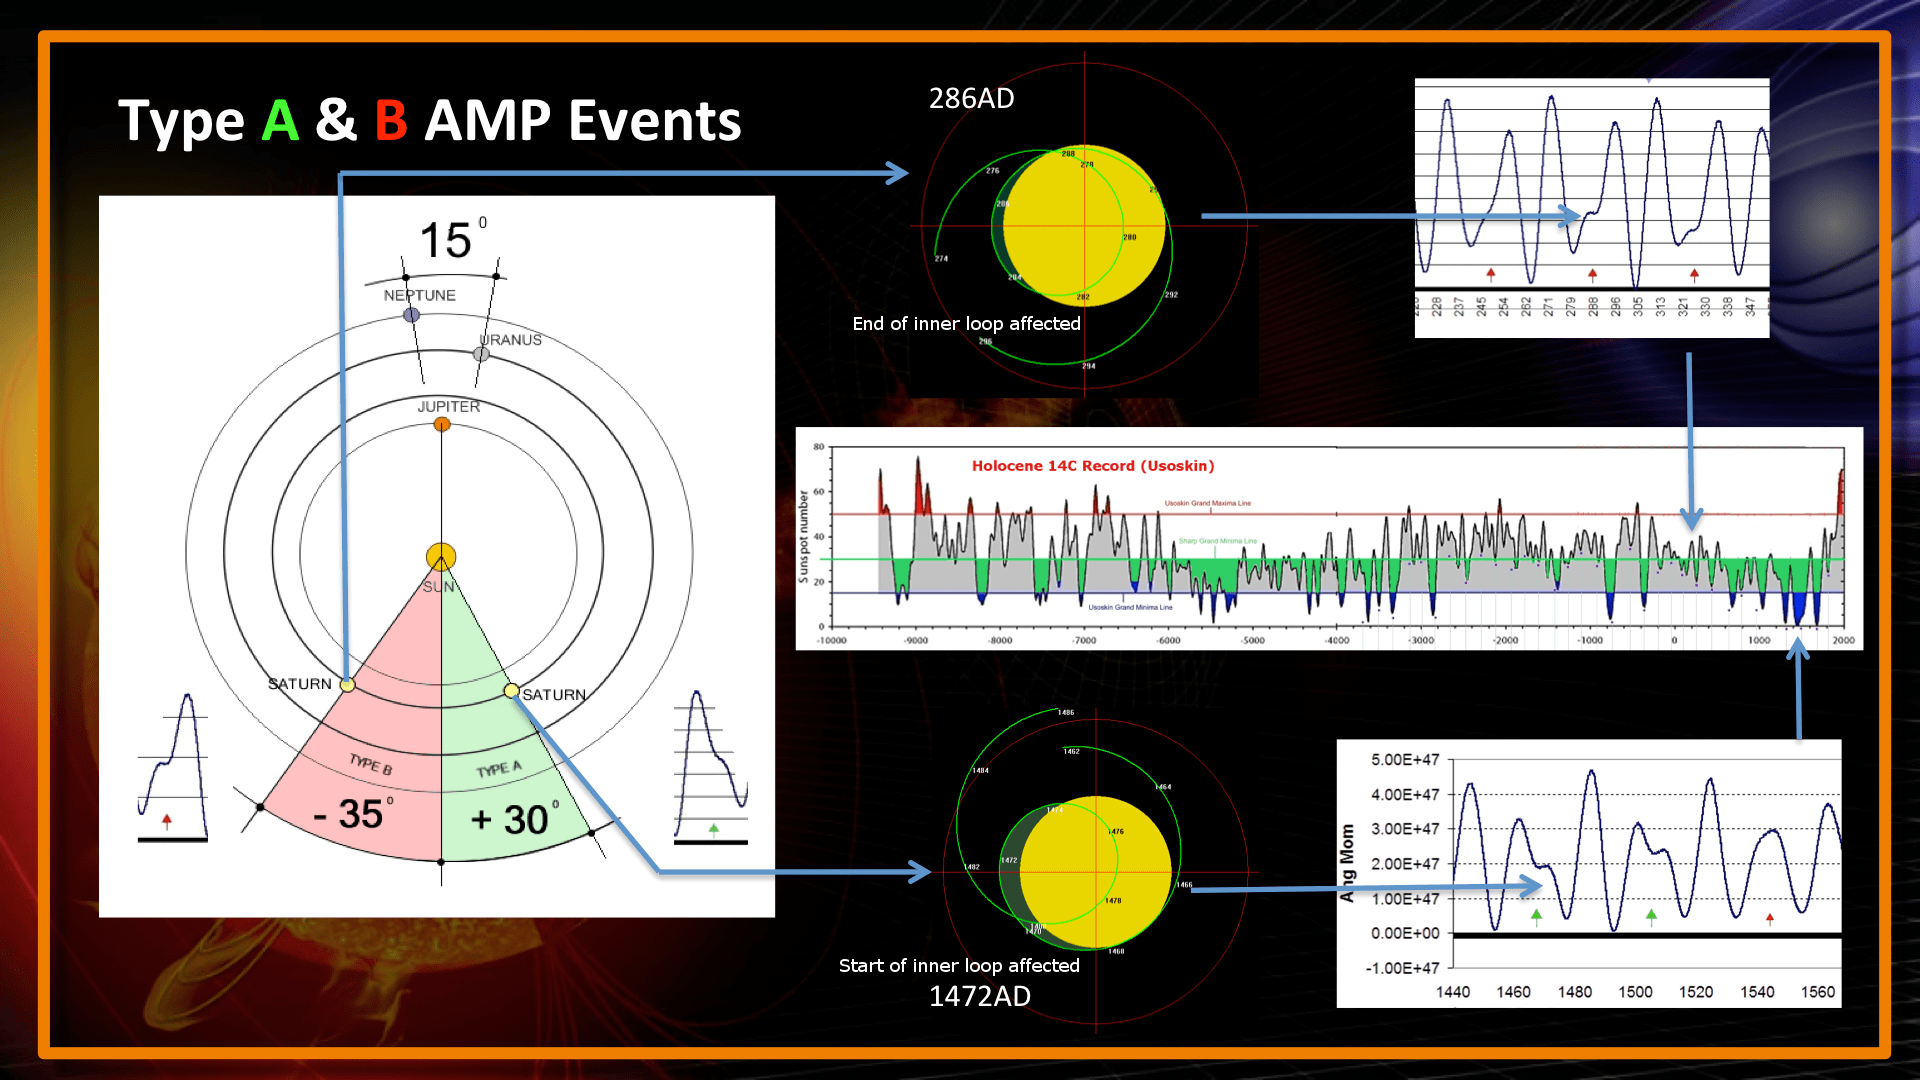
“Observations suggest a Jupiter/Saturn angle of around +30 deg produces the deepest and most prolonged grand minima if the Neptune/Uranus angle is low (smaller gap between them), like the Sporer Minimum pattern above. Other variations can exist to produce a strong grand minimum but are rare. The Jupiter/Saturn angle when Neptune and Uranus come together is the key to the fluctuations in the 11000 year record and is anything but random as some suggest.”
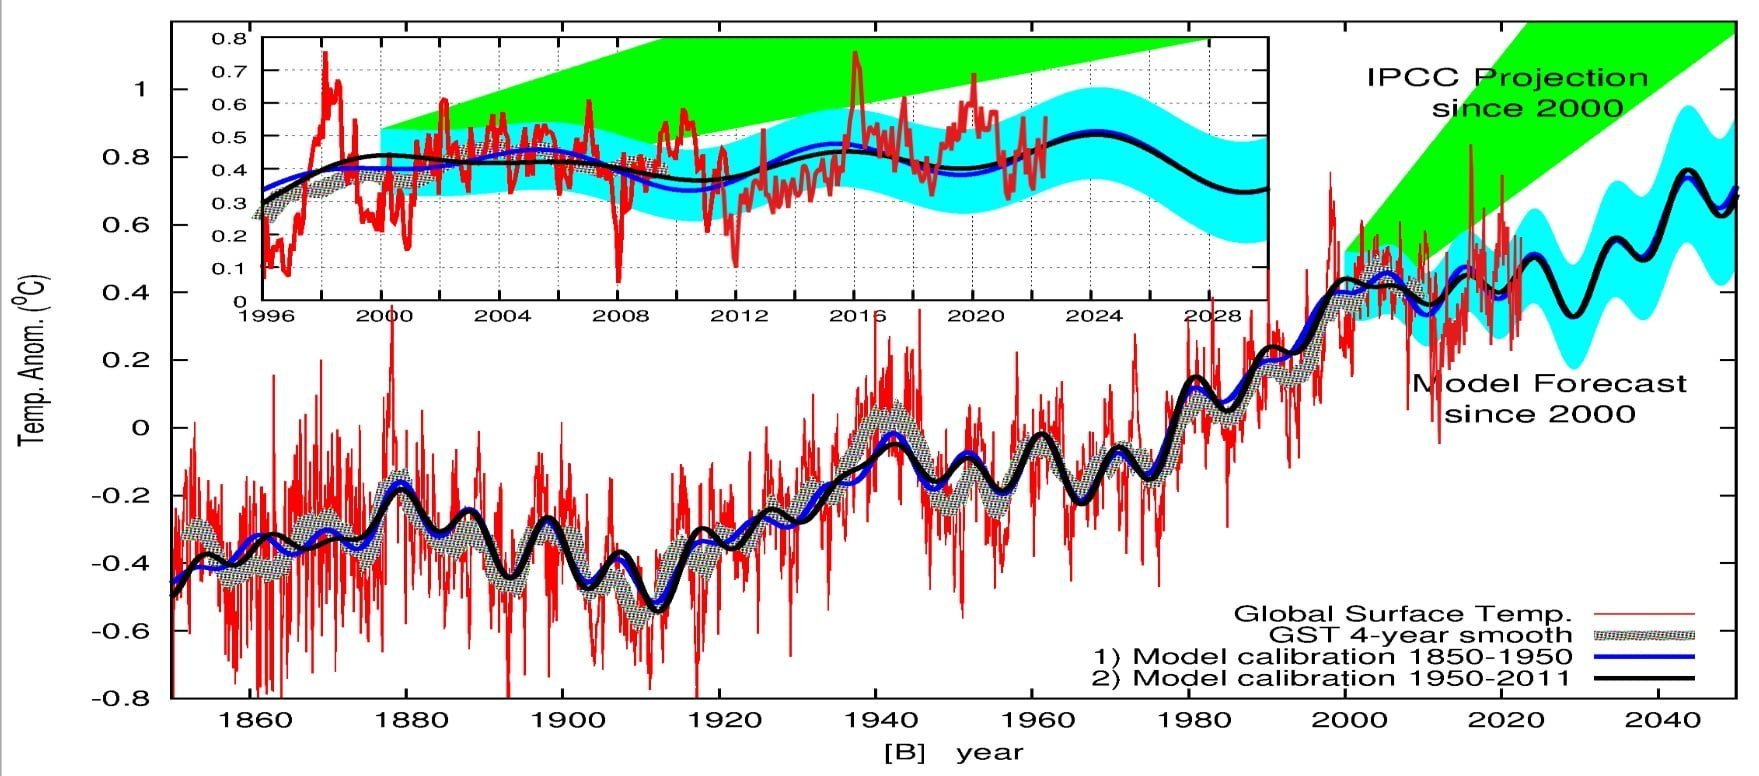
In 2012 Dr. Nicola Scafetta published a paper in which he presented a climate model utilizing astronomical harmonics (planetary movements) as a proxy for global temperature. He used this model to forecast future temperatures (starting in 2000) based on these harmonics (blue band), and compared his forecast to the IPCC’s 2007 greenhouse gas warming model predictions (green band).
I have appended the past 10 years of global temperature anomaly records to his 2012 chart (red line) to bring it almost up to date (July 2022). As can be seen, Scafetta’s model is spectacularly outperforming the IPCC’s greenhouse warming predictions (so far).
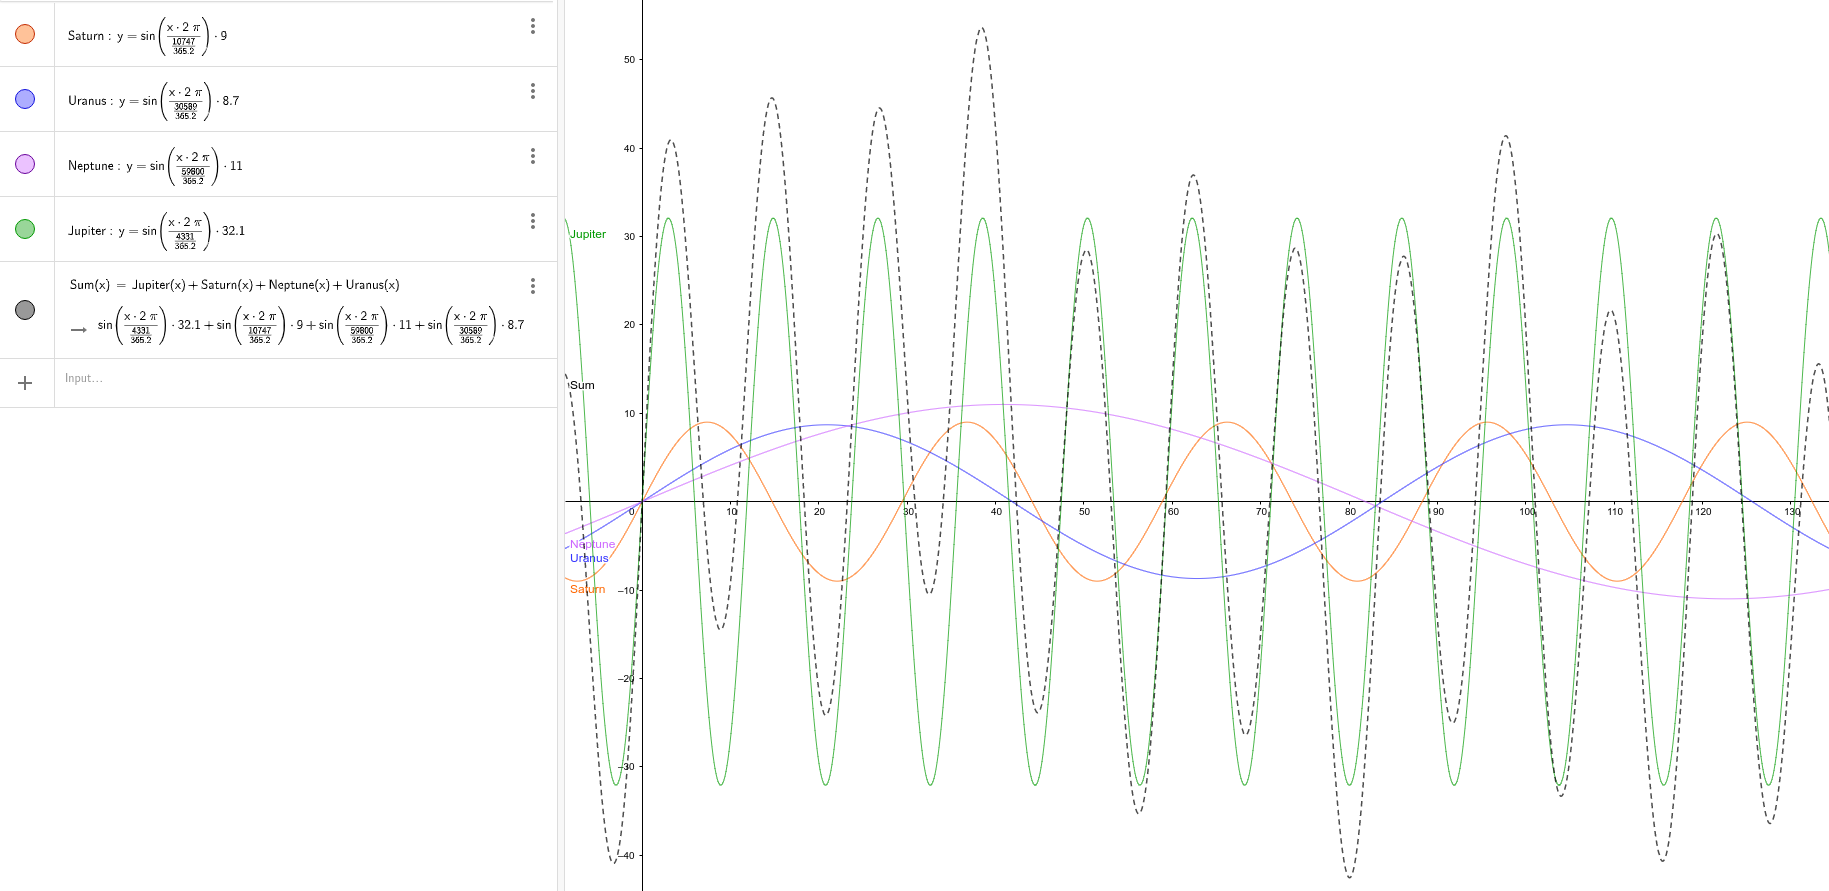
When the orbital periods of the four gas giants and their masses are represented by sine waves on a chart (solid color lines) and their values are summed (black dotted line), the result correlates with the extent of the Sun’s deviation from the solar system barycentre over time.
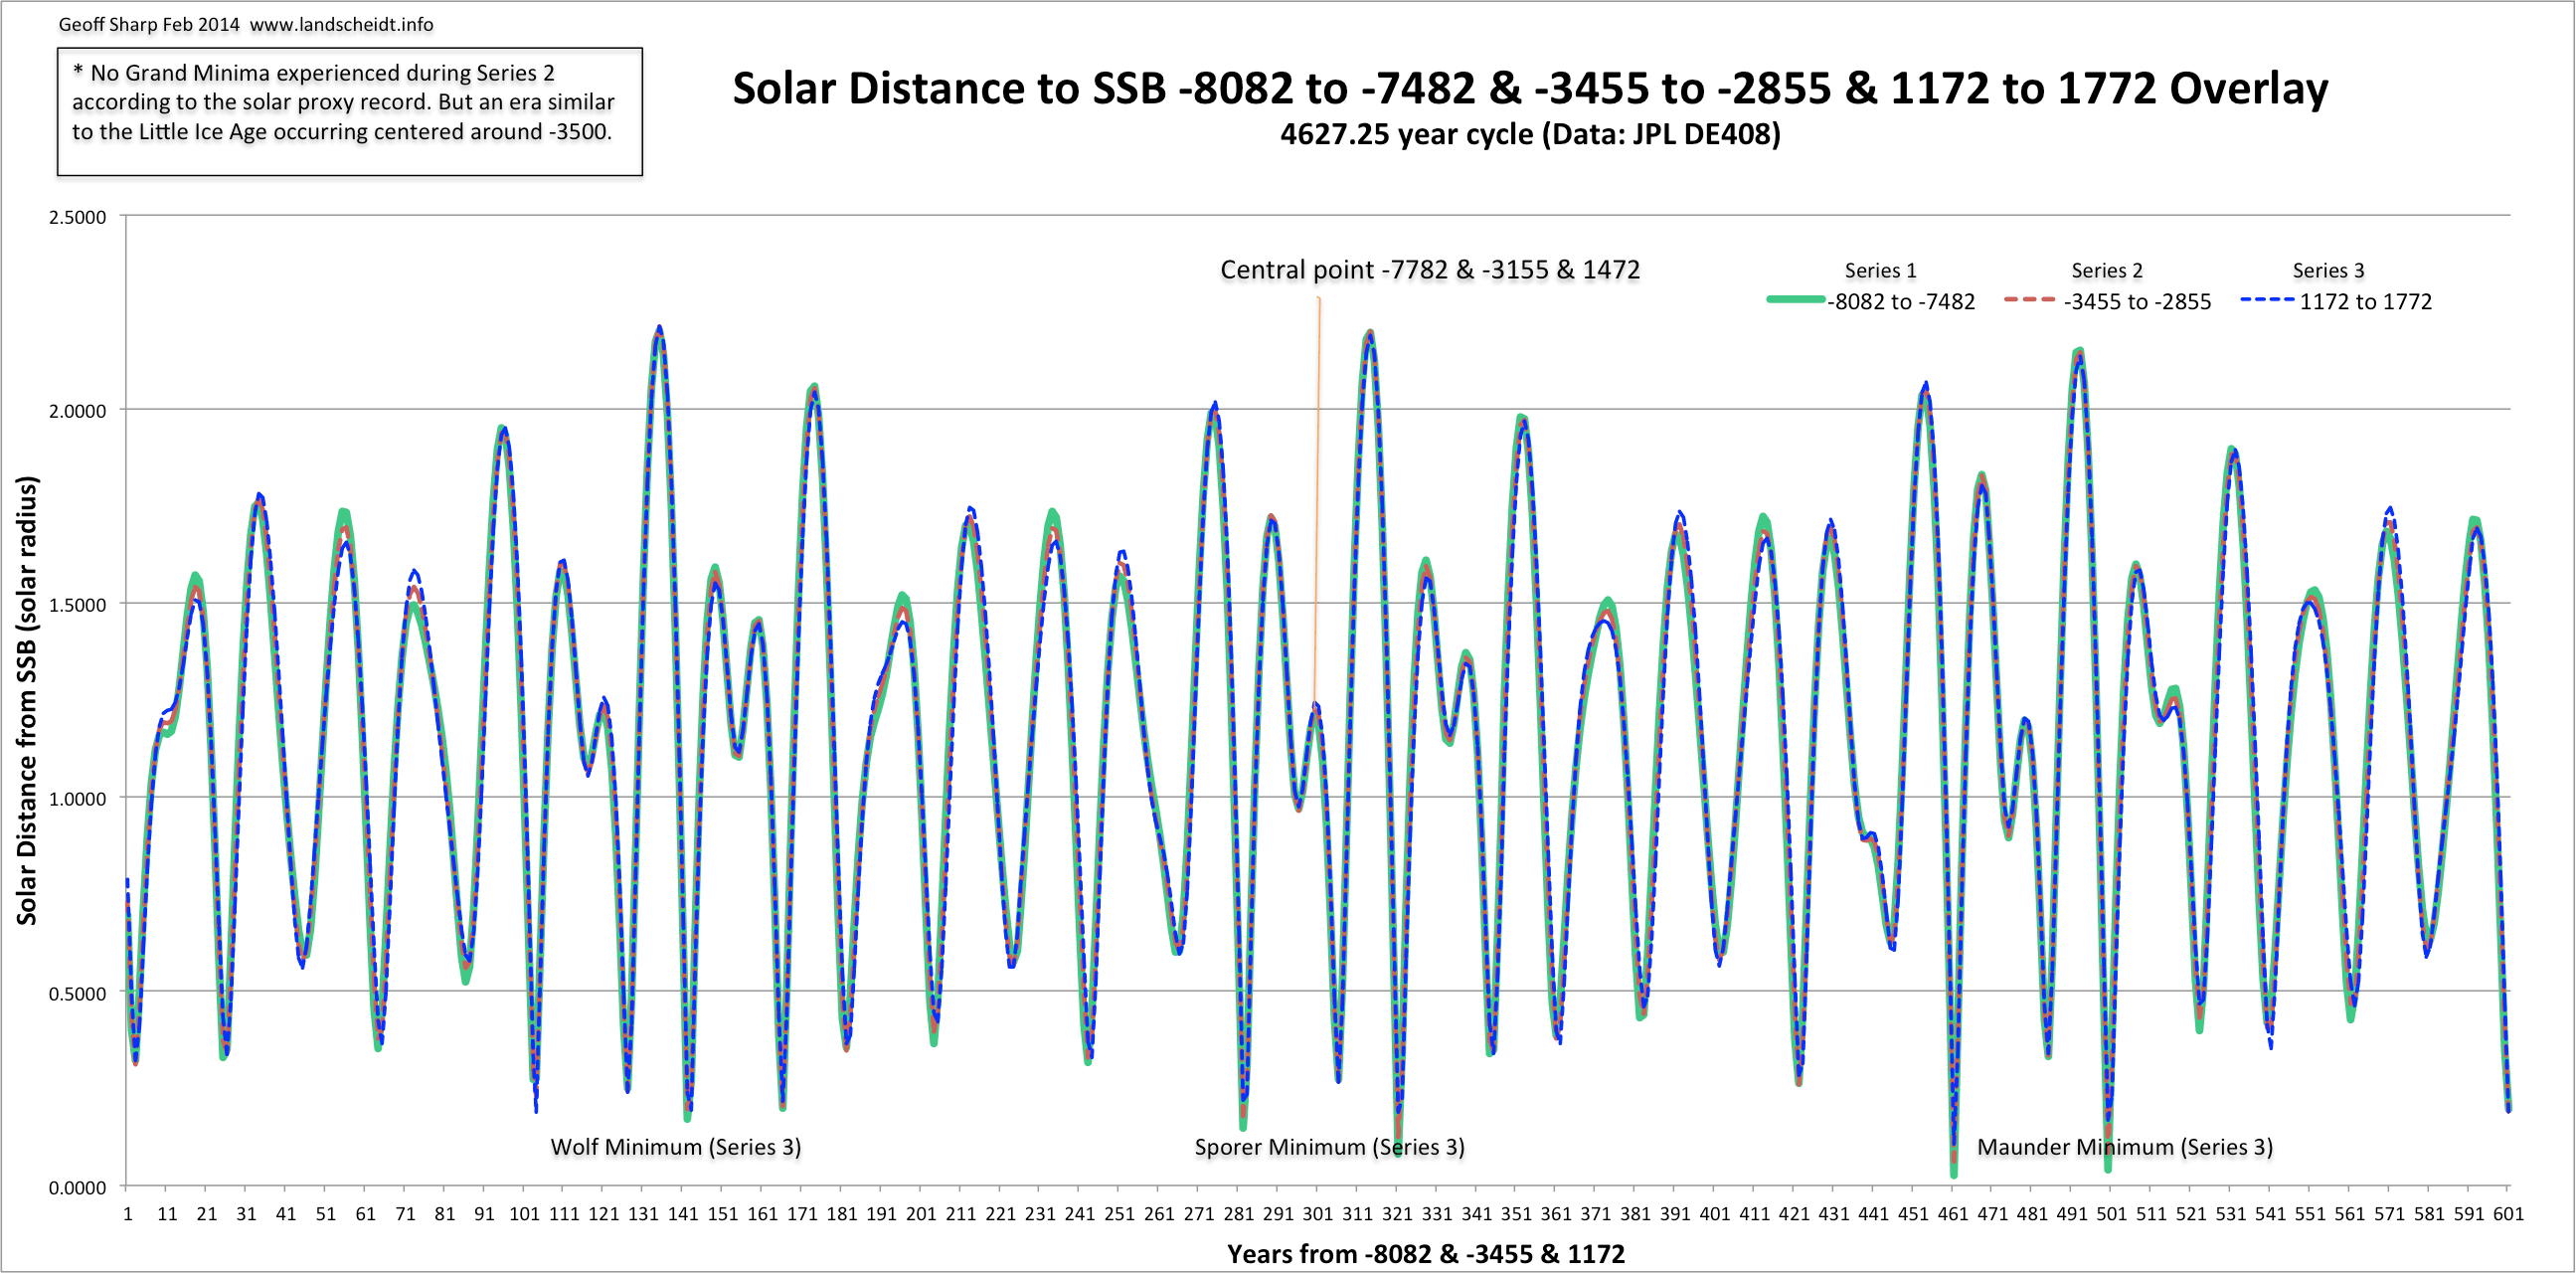
This is Geoff Sharp’s visualization of this planetary rhythm overlaid for the most three most prominent recent solar minimums, each falling on 4,627 years grand conjunction boundaries.
When we look at the same Solar/SSB deviations plotted over 20,000 years, the multiple interlocking rhythms become starkly apparent. The outer four planets repeat their grand cycle every 4,627 years, with numerous harmonics. These rhythms are also observed in solar activity and climate cycles.
The red dots show the peak excursion of the solar outer loop orbits when the outer 4 are in grand conjunction every 4627 years. The secondary lower peaks are the Hallstatt type peaks where the Grand conjunction doesn’t quite happen in the middle of the 4627 year cycle.
It has been well established for many years that a quasi 2100-2500 year deep grand minima cycle exists in the C14 and 10Be solar proxy record that exists over the Holocene (past 11,500 years). 14C and 10Be are isotopes that are formed in the top of our atmosphere from collisions with Intergalactic rays generated from Supernova explosions throughout the Universe. These isotopes get taken up by trees or deposited in ice at the poles and provide a mostly reliable source of info on how the Sun’s activity changed over the Holocene. During times of grand minima the solar wind is weaker and allows more galactic rays into our solar system
The following graph is the 14C record that shows clearly the large deep groups of grand minima (that stand out from smaller grand minima) that form Little Ice Age clusters like seen between 1250 and 1850 AD.
Winter Lullaby
There is ever-mounting evidence warning the next epoch will be one of sharp terrestrial cooling due to a relative flat-lining of solar output. The exact time-frame and depth of this next chill of solar minimum is still anyone’s guess, and the parameters involved (i.e., galactic cosmic rays, geomagnetic activity, solar wind flux etc.) remain poorly understood. However, there are some great minds on the job, and below I’ve collated 11 best-guesses based on published scientific papers from respected researchers in the field. The list begins with eminent Russian astrophysicist K. Abdussamatov–though it is in no particular order.
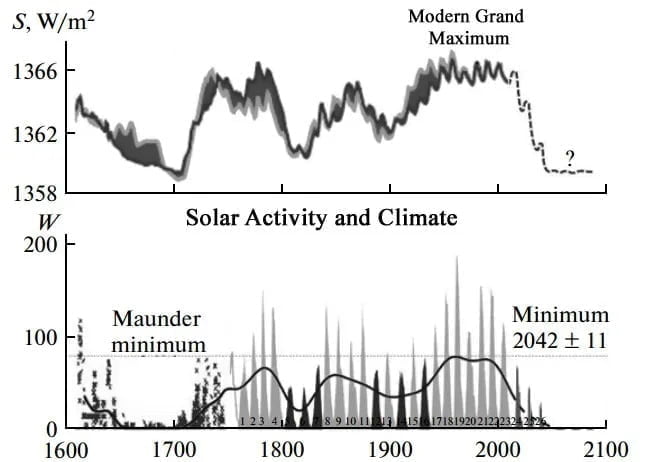
- ABDUSSAMATOV (2016) : The quasi-centennial epoch of the new Little Ice Age has started at the end 2015 after the maximum phase of solar cycle 24. The start of a solar grand minimum is anticipated in solar cycle 27 ± 1 in 2043 ± 11 and the beginning of phase of deep cooling in the new Little Ice Age in 2060 ± 11.
- ZHARKOVA (2020) : The Sun has entered into the modern Grand Solar Minimum (2020–2053) that will lead to a significant reduction of solar magnetic field and activity like during Maunder minimum leading to noticeable reduction of terrestrial temperature.
- SANCHEZ-SESMA (2016) : This empirical modeling of solar recurrent patterns has also provided a consequent multi-millennial-scale experimental forecast, suggesting a solar decreasing trend toward grand (super) minimum conditions for the upcoming period, AD 2050–2250 (AD 3750–4450).
- SÁNCHEZ-SESMA (2015) : These millennial-scale patterns of reconstructed solar activity variability could justify epochs of low activity, such as the Maunder Minimum, as well as epochs of enhanced activity, such as the current Modern Maximum, and the Medieval Maximum in the 12th century.
- MÖRNER (2015) : By about 2030-2040, the Sun will experience a new grand solar minimum. During the previous grand solar minima—i.e. the Sporer Minimum (ca 1440-1460), the Maunder Minimum (ca 1687-1703) and the Dalton Minimum (ca 1809-1821)—the climatic conditions deteriorated into Little Ice Age periods.
- MÖRNER (2018) : Several scientists (e.g. [Landscheidt, 2003] [Charvátová, 2009] [Mörner, 2010] [ Mörner, 2015] [Abdussamatov, 2016]) have shown that we, in fact, are approaching a New Grand Solar Minimum in about 2030-2050. In analogy with the documented climate conditions during the Spörer, Maunder and Dalton Minima, we may expect the return of a New Little Ice Age.”
- BIANCHINI AND SCAFETTA (2018) : A simple harmonic model based on the 9.98, 10.9 and 11.86 year oscillations hindcast reasonably well the known prolonged periods of low solar activity during the last millennium such as the Oort, Wolf, Sporer, Maunder and Dalton minima.
- MCCRANN ET AL. (2018) : The effect of the Sun’s activity on Earth’s climate has been identified since the 1800s. In agreement with many studies that have identified a 60-year cycle in the variation of Earth’s temperature, it is expected that surface temperatures will reach a trough of the cycle around 2030-2040.
- YNDESTAD AND SOLHEIM (2017) : Deterministic models based on the stationary periods confirm the results through a close relation to known long solar minima since 1000 A.D. and suggest a modern MAXIMUM period from 1940 to 2015. The model computes a new Dalton-type sunspot MINIMUM from approximately 2025 to 2050
- FLEMING (2018) : The cause of the Medieval Warm Period and the Little Ice Age climate changes was the solar magnetic field and cosmic ray connection. When the solar magnetic field is strong, it acts as a barrier to cosmic rays entering the Earth’s atmosphere, clouds decrease and the Earth warms.
- ABDUSSAMATOV (2012) :
11 Scientific Predictions for the Upcoming Grand Solar Minimum
Cataclysmic Symphony
The author of An Apocalyptic Synthesis believed that the date of the next great cataclysmic event would fall in late December 2023 (or possibly 2024), and that it would be electromagnetic in nature, based upon his research into astronomical harmonics and numerous other fields over more than a decade. He died of a heart attack in late August, 2022, and his website content was taken down. The video clip was published August, 2021.
Brian Lambert, a proponent of the EMPCOE (Electro-Magnetic Plasma Change Over Event) theory, similarly thought that the date would be around late December, 2024. He too is dead, reportedly by “self-inflicted” gunshot to the head. His partner apparently suffocated with a pillow.
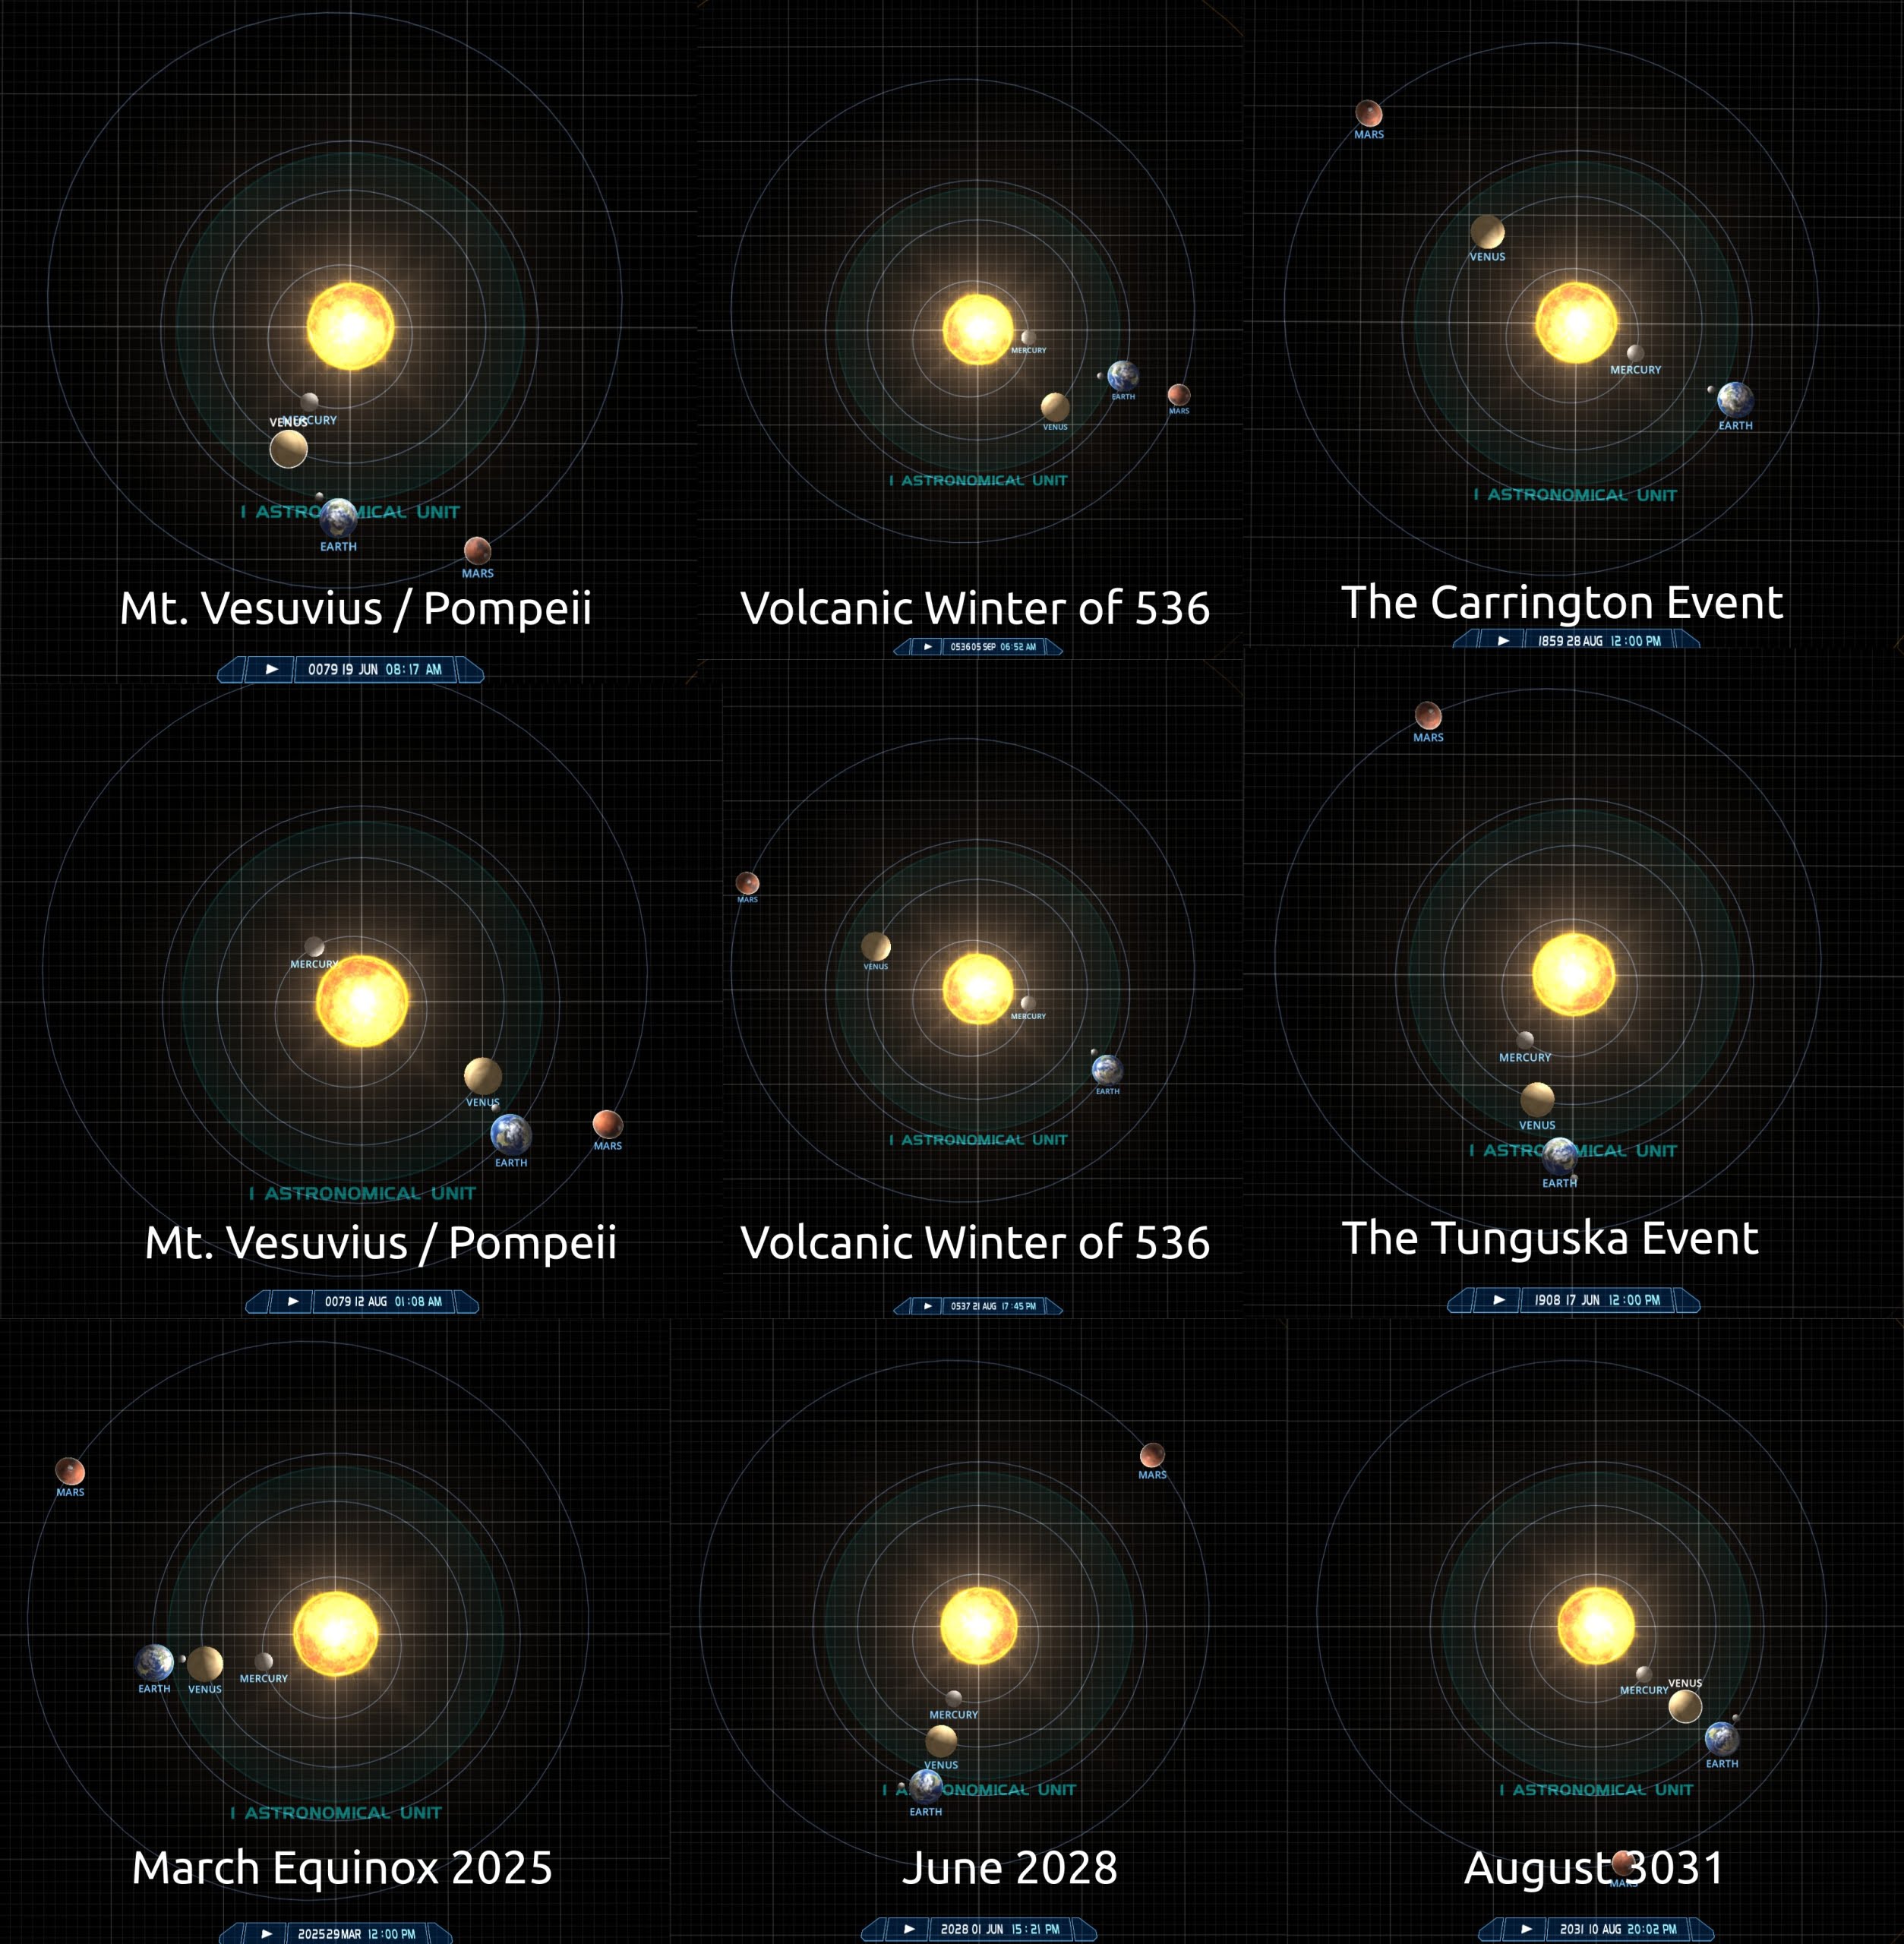
My own research leads me to think that the event may happen between the March 2025 equinox and August 3031, based upon historical planetary alignment and event correlations.
The Younger Dryas
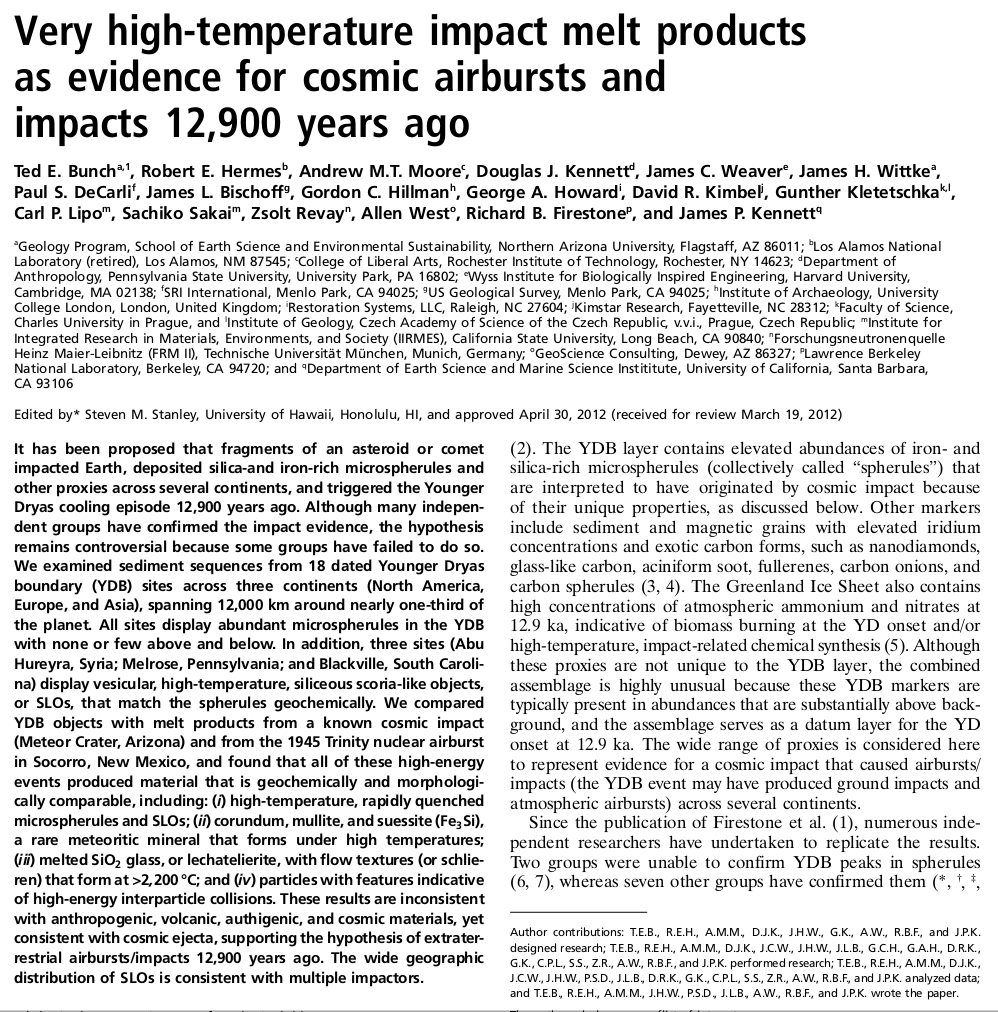
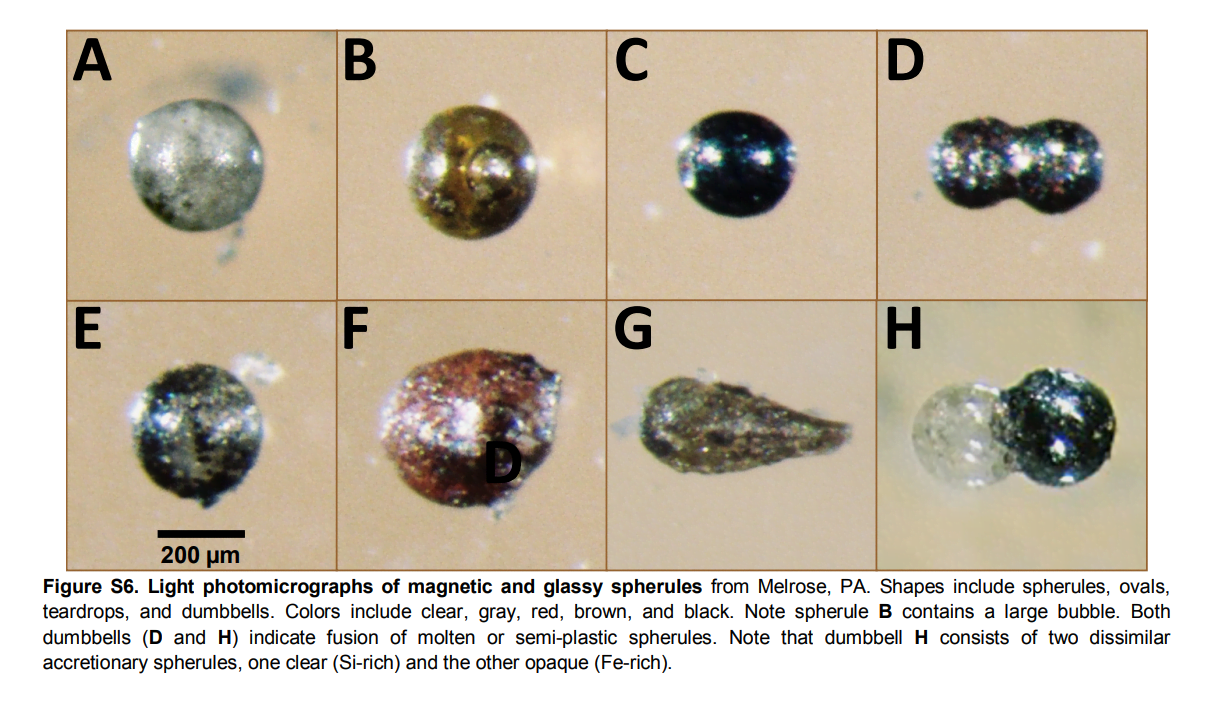
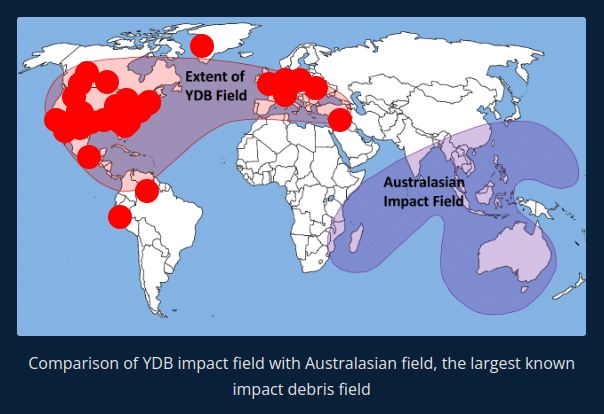 At least 18 sites, dating from the onset of the Younger Dryas extinction event (~12,900-11,700 years BP), and spanning an area of more than 12,000 km, exhibit the same physical evidence as Tunguska and Tall el-Hammim. Few impact craters, minimal to no impactor fragments, extremely high temperatures (>2,200°C), and an abundance of vitrified rock and nano- to micro-scale metallic and silica spheroids commonly found in the vicinity of cosmic impacts, nuclear detonations and lightning strikes. Since there were probably no nukes 12,900 years ago, and there’s little evidence of any impacts, then we’re left with lightning. Interplanetary electrical discharges? The authors of this paper favor cosmic meteor airbursts as the explanation.


